
Graph Walking Challenge
I was given the velocity time graph above and then told to construct a position time, motion map, and table of values. Then, there were 3 questions to answer, and each had to be answered 3 times: one answer was based on the velocity time graph, another answer was based on the position time graph, and the last answer was based on the motion map.
The Position Time Graph
I started with the position time graph. After looking at the velocity time graph, I could see that the velocity for the first 2 seconds was -2 meters/second. This means that the slope of the position time graph for the first 2 seconds should be -2 because the velocity is simply the slope of the position time graph. For the next segment, the velocity is 1.5 meters/second for 1 second and then 1 meter/second for the next second. So, the position time should have a slope of 1.5 for 1 second and a slope of 1 for the next second. Next, the velocity is zero for one second, -1 meter/second for the next second, and the 1/2 meters/second for the final 2 seconds indicated on the velocity time graph. Therefore, the position time should have a horizontal line for one second (this segment has a slope of zero), a slope of -1 for another second, and finally a slope of 1/2 for 2 seconds. The only thing that is not indicated by the velocity time is the starting point of the motion. I will assume the object in motion started at the origin and proceed to construct my position time graph, pictured below.

Motion Map
The starting point was chosen at zero, and 2 dots (signifying 2 seconds) were placed in the negative direction, each 2 meters away from the previous to show the velocity of -2 meters/second. Next, the following dot was placed 1.5 meters in front of the previous dot to show a velocity of 1.5 meters/second for one second. Next, the subsequent dot was placed 1 meter in front of befor to show a velocity of 1 meter/second. Next, a dot was stacked on top of the previous dot and the next dot was placed 1 meter behind the 2 stacked dots to show 1 second of no motion and then 1 second of a -1 meter/second velocity. Finally, 2 dots were placed 1/2 a meter away from each other and the previous point to show that the object went forward at 1/2 meter/second for 2 seconds. The resulting motion map is pictured below.
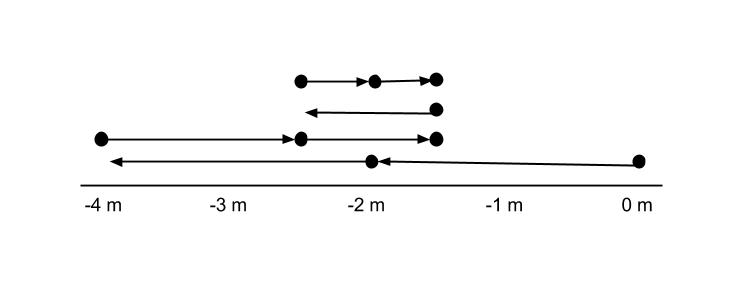
Table of Values
After acquiring the position time graph, the points were rather easy to collect. I simply found the coordinates of the points represented at 1 second intervals. The coordinate was in the form (time, position), the position was easily found. Another way to find the values is to look at the dots on the motion map. This would indicate where the object was at one second intervals. To find the velocity, I simply found the slope between every 2 points. Because the slope of the position time graph is velocity, the velocity was calculated.
|
T
0 secs 1 secs 2 secs 3 secs 4 secs 5 secs 6 secs 7 secs 8 secs |
X
0 meters -2 meters -4 meters -2.5 meters -1.5 meters -1.5 meters -2.5 meters -2 meters -1.5 meters |
V
-2 m/sec -2 m/sec 1.5 m/sec 1 m/sec 0 m/sec -1 m/sec 0.5 m/sec 0.5 m/sec |
Question 1 : What was the distance traveled between 3 and 6 seconds?
From the Velocity Time Graph:
The area under the curve on a velocity time graph gives displacement, and the the area under the absolute value of the velocity time graph gives the distance (this is because distance accounts for the total distance traveled regardless of direction.
Area for 3 seconds to 4 seconds is a rectangle:
The area under the curve on a velocity time graph gives displacement, and the the area under the absolute value of the velocity time graph gives the distance (this is because distance accounts for the total distance traveled regardless of direction.
Area for 3 seconds to 4 seconds is a rectangle:
A= B x H Δx= v * t
Δx= 1 x 1
Δx = 1 meter
Δx= 1 x 1
Δx = 1 meter
Area for 5 seconds to 6 seconds is a same sized rectangle, so the area is also 1 meter. (4 seconds to 5 seconds can be ignored because there is no motion during this time span). The total distance traveled is 1 meter + 1 meter = 2 meters traveled.
From the Position Time Graph:
The approach to this is very similar, except that Δx can be seen directly on the graph by subtracting the final position from the initial position. The distance traveled between 3 and 4 seconds is -1.5 - (-2.5) = 1 meter. The distance traveled between 5 and 6 seconds is the absolute value of (-2.5 - (-1.5)) = 1 meter. The total distance is 2 meters traveled.
From the Motion Map:
The length of the arrow between the 4th and 5th point (which represent t=3 and t=4) is 1 meter. The length of the arrow between the 6th and 7th point is also 1 meter. The total distance traveled is 1 meter + 1 meter = 2 meters traveled.
The length of the arrow between the 4th and 5th point (which represent t=3 and t=4) is 1 meter. The length of the arrow between the 6th and 7th point is also 1 meter. The total distance traveled is 1 meter + 1 meter = 2 meters traveled.
Question 2: What was the total displacement between 3 and 6 seconds?
From the Velocity Time Graph:
This problem is very similar to the distance problem, except that areas below the t axis must be considered as moving back, or negative displacement. The area under the curve from 3 to 4 is 1 meter, and the area from 5 to 6 seconds is -1 meters. Hence, the total displacement is 1-1= 0 meters.
From the Position Time Graph:
Displacement on the position time graph can be calculated by subtracting the initial position from the final position. The final position is -2.5 meters and the initial position is also -2.5 meters. -2.5- (-2.5) = 0 meters of displacement.
From the Motion Map. The dots representing the 3rd second and the 6th second are both in the same location (at the -2.5 meter mark). This indicates that there is no change in position, so there is no displacement.
Question 3: What are the average speed and average velocity between 3 and 6 seconds?
Speed is equal to distance over time. The distance that was calculated was 2 meters traveled, and this took place over 3 seconds. So, the average speed is 2 meters / 3 seconds or 0.667 m/sec.
Velocity is equal to displacement over time. The displacement that was calculated was 0 meters traveled, and this took place over 3 seconds. So, the average velocity is 0 meters/ 3 seconds = 0 m/sec.
Velocity is equal to displacement over time. The displacement that was calculated was 0 meters traveled, and this took place over 3 seconds. So, the average velocity is 0 meters/ 3 seconds = 0 m/sec.
